Probability Distributions and Hypothesis Tests: A Calc Pro Guide
Find normal, binomial, Poisson, t and chi-square probabilities, build confidence intervals and run t-tests with Calc Pro's statistics tools.
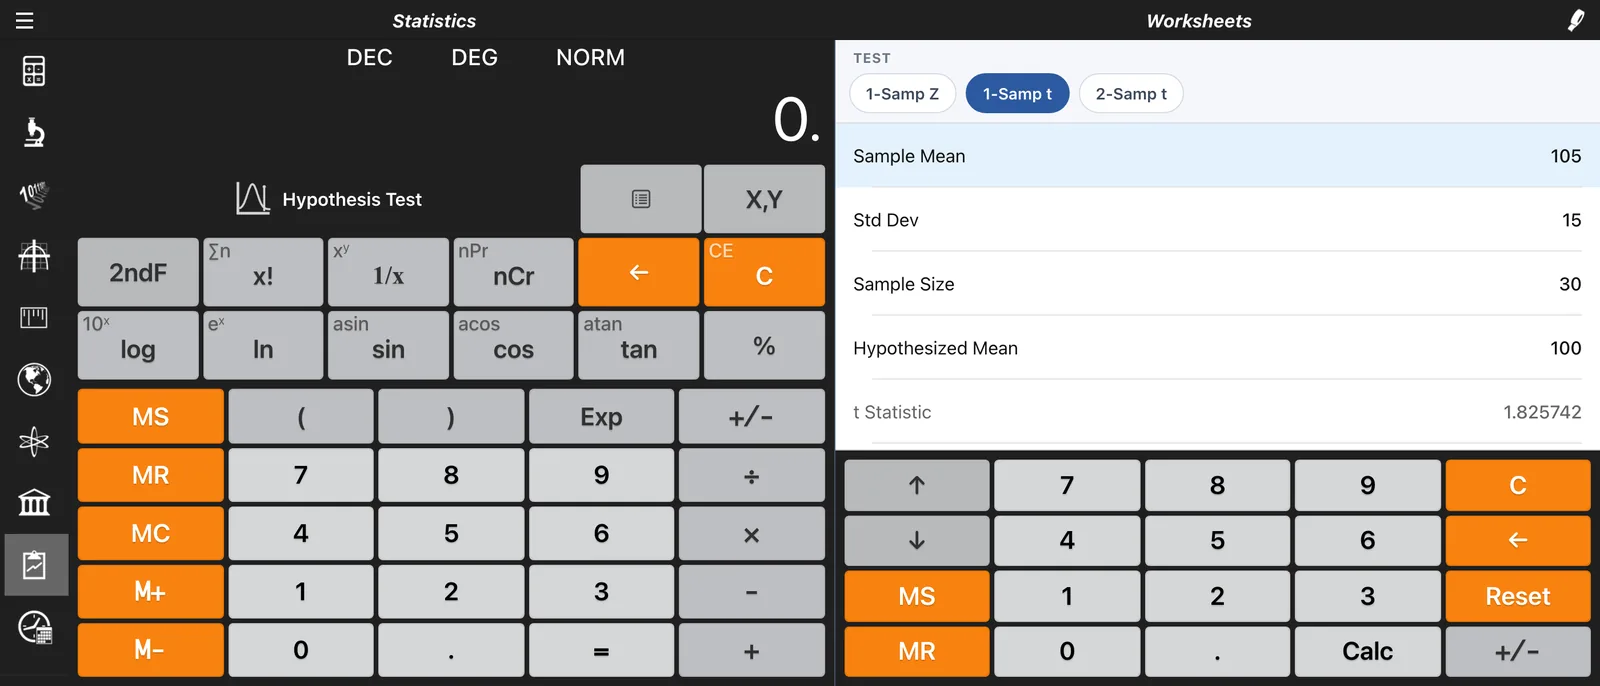
Statistics classes are full of lookup tables: z-tables, t-tables, chi-square tables. Calc Pro's Statistics calculator replaces them with three tools, Distributions, Confidence Interval and Hypothesis Test, that give you exact probabilities and p-values in seconds.
Open the Statistics calculator and choose the tool from the list on the right. In the iPhone and iPad app these tools are part of Pro Premium; they're free in the web version.
Probability Distributions
Normal
Enter the Mean, Std Dev and an X Value.
Example: IQ scores have a mean of 100 and a standard deviation of 15. What share of people score 130 or less?
- z-Score: 2
- P(X ≤ x): 0.97725, so about 97.7% score 130 or less
- P(X ≥ x): 0.02275, so about 2.3% score 130 or more
Inverse Normal
Work backwards from a probability to a value.
Example: what IQ score marks the top 10%? Enter a mean of 100, a standard deviation of 15 and a probability of 90%. The answer is an x value of 119.22.
Binomial
For a fixed number of yes/no trials. Enter the Trials (n), the Success Prob. and the Successes (k).
Example: flip a fair coin 10 times. What's the chance of exactly 7 heads?
- P(X = k): 0.117188, about 11.7%
- P(X ≤ k): 0.945312, the chance of 7 or fewer heads
- P(X ≥ k): 0.171875, the chance of 7 or more heads
Poisson
For counts of events over time or space. Enter the Mean (λ) and the Events (k).
Example: a help desk gets 4 calls an hour on average. What's the chance of exactly 2 calls in the next hour?
- P(X = k): 0.146525, about 14.7%
- P(X ≤ k): 0.238103, 2 calls or fewer
- P(X ≥ k): 0.908422, 2 calls or more
t-Dist
Enter the Deg. of Freedom and a t Value.
Example: with 10 degrees of freedom and t = 2.228:
- P(T ≤ t): 0.974994
- P(T ≥ t): 0.025006
- Two-Tail p: 0.050012, which is why 2.228 is the familiar 5% critical value for 10 degrees of freedom
Chi-Square
Enter the Deg. of Freedom and a χ² Value.
Example: with 5 degrees of freedom and χ² = 11.07:
- P(X ≤ x): 0.94999
- P(X ≥ x): 0.05001, right at the 5% significance level
Confidence Intervals
Estimate a population mean from a sample. Choose Z (σ known) when you know the population standard deviation, or t (σ unknown) when you only have the sample's.
Example: a sample of 25 batteries lasts an average of 52 hours, with a standard deviation of 8 hours. Find a 95% confidence interval using t:
- Critical Value: 2.063899
- Margin of Error: 3.302238
- Lower Bound: 48.697762
- Upper Bound: 55.302238
You can be 95% confident that the true average battery life is between about 48.7 and 55.3 hours.
Hypothesis Tests
Test a claim about a mean. Choose 1-Samp Z, 1-Samp t or 2-Samp t.
One-Sample t-Test
Example: the manufacturer claims the batteries last 50 hours. Your sample of 25 averages 52 hours, with a standard deviation of 8. Is the difference significant?
Enter a Sample Mean of 52, a Std Dev of 8, a Sample Size of 25 and a Hypothesized Mean of 50:
- t Statistic: 1.25
- Deg. of Freedom: 24
- Two-Tail p: 0.223351
- One-Tail p: 0.111676
With p = 0.22, well above 0.05, the data doesn't show that the batteries last longer than claimed. The difference could easily be chance.
Two-Sample t-Test
Compare the means of two groups. Calc Pro uses Welch's t-test, which doesn't assume the two groups have the same spread.
Example: class A (30 students) averages 78 with a standard deviation of 10. Class B (28 students) averages 72 with a standard deviation of 12. Is the difference significant?
- t Statistic: 2.060871
- Deg. of Freedom: 52.72
- Two-Tail p: 0.044264
- One-Tail p: 0.022132
With p = 0.044, below 0.05, the difference between the classes is statistically significant at the 5% level.
Tips
- Pick one or two tails before you test. Use two-tail p unless you predicted the direction of the difference in advance.
- Use t when σ is unknown. That's almost always the case with real data.
- Significant isn't the same as important. A tiny difference can be significant with a big enough sample; check whether it matters in practice.
- Save your work. With Pro Premium, e-mail or save your results as a PDF.
For regression, descriptive statistics and data entry, see the Statistics Calculator guide.
Back to the start: Getting Started with Calc Pro

Calc Pro
4.6 · 4,712 ratingsPut the Statistics Calculator to work
Use it free in your browser right now, or take Calc Pro with you on iPhone and iPad.
Take it with you




Free with ads · In-app purchase unlocks the full Pro Premium version