Graphing Calculator Guide: Plot and Compare Up to 8 Equations
Plot up to 8 equations at once with Calc Pro's graphing calculator. Learn to enter functions, compare curves, find points and show tangents.
The Graphing Calculator in Calc Pro transforms abstract equations into visual insights. Whether you're studying calculus, exploring trigonometry, or analyzing data trends, this guide will show you how to create beautiful, informative graphs.
Overview
The Graphing Calculator features:
- Multiple function slots: Plot up to 8 functions simultaneously
- Color-coded graphs: Each function has a distinct color
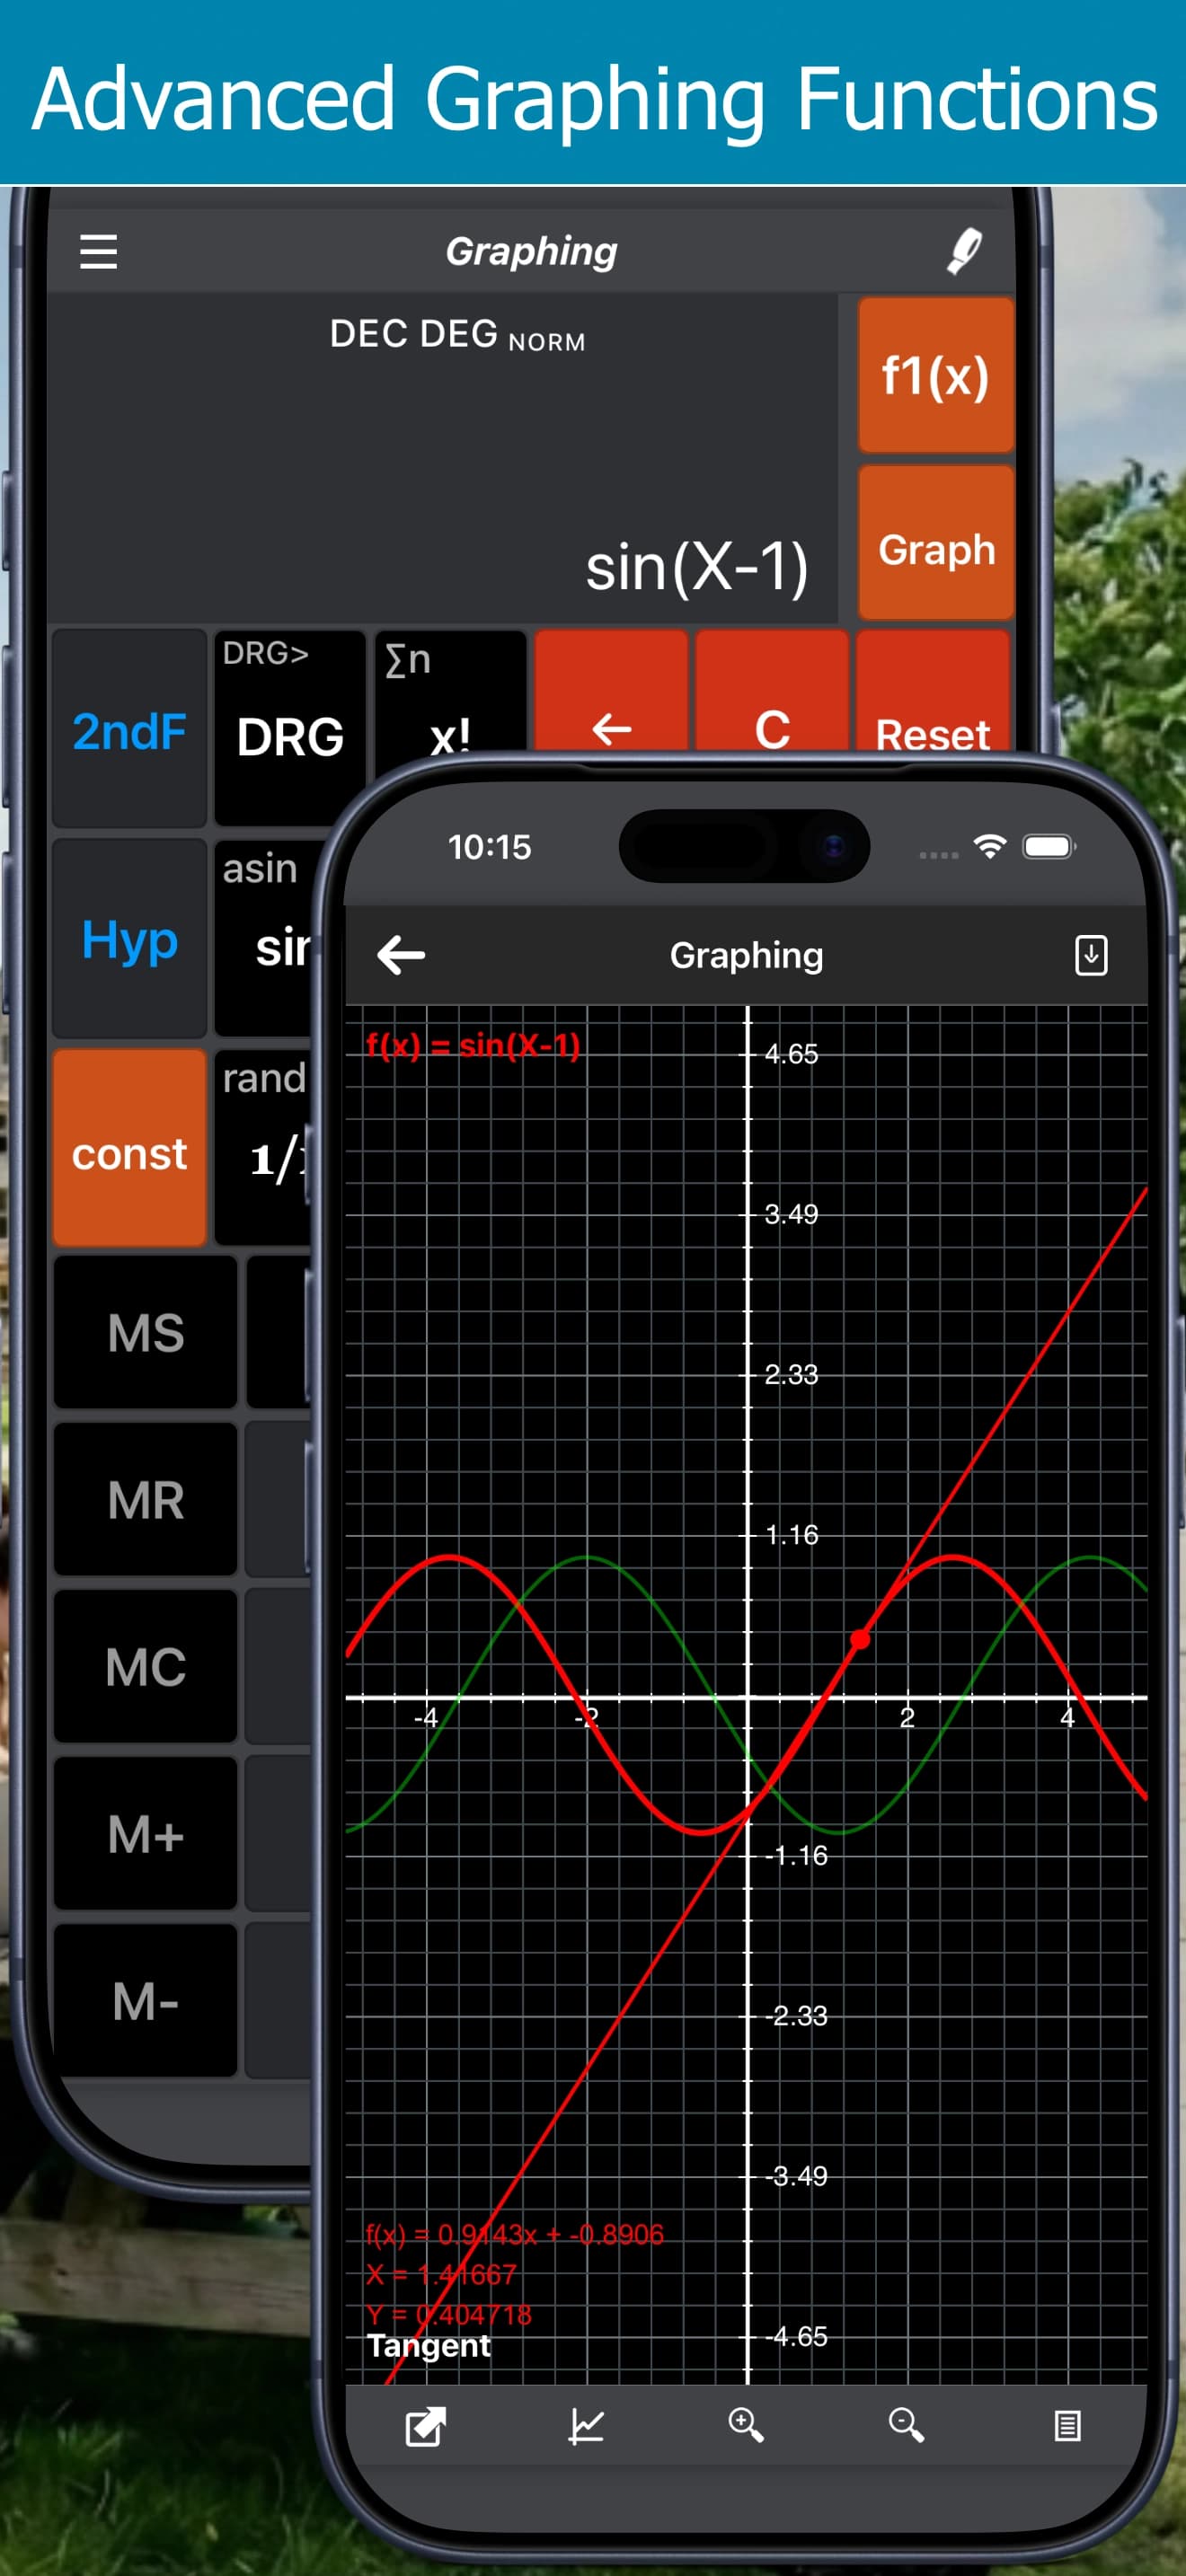
- Interactive graph area: Zoom, find points on a graph and show tangent lines
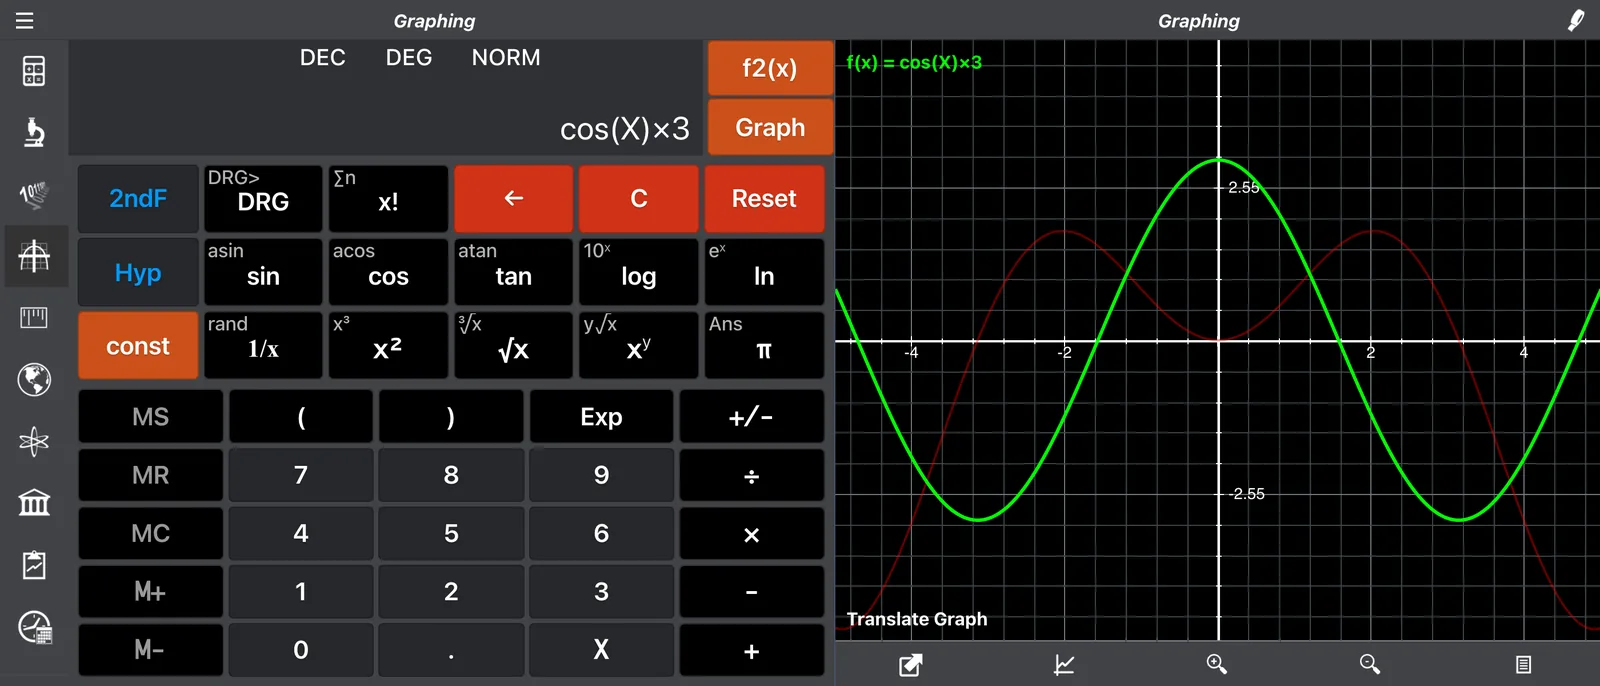
- Function keyboard: Easy equation entry
- Sharing: E-mail your equations along with an image of the graph
The Interface
Function Entry Area
Calc Pro gives you eight function slots, f₁(x) through f₈(x). Enter an equation in any slot and it's drawn in that slot's color, so you can tell your graphs apart at a glance.
Graph Display
The main area shows the coordinate plane with:
- X and Y axes
- Grid lines for reference
- Your plotted functions in their assigned colors
Function Keyboard
A specialized keyboard for entering mathematical expressions:
- Variable x button
- Operators: +, −, ×, ÷
- Functions: sin, cos, tan, log, ln
- Powers: x², x³, xⁿ
- Constants: π, e
- Parentheses for grouping
Entering Your First Function
Example: Plot y = x²
- Tap on the f₁(x) = input field
- Press: x
- Press: x² (or x ^ 2)
- The graph automatically displays a parabola!
Plotting Multiple Functions
Example: Compare y = sin(x) and y = cos(x)
First function:
- Tap f₁(x) =
- Press: sin ( x )
- The sine wave appears
Second function: 4. Tap f₂(x) = 5. Press: cos ( x ) 6. The cosine wave appears in a second color
Now you can see both waves and observe:
- The phase shift between them
- Where they intersect
- Their identical periods and amplitudes
Common Function Types
Linear Functions (y = mx + b)
Example: y = 2x + 3
- Press: 2 × x + 3
Example: y = −x + 5
- Press: (−) x + 5
Quadratic Functions (y = ax² + bx + c)
Example: y = x² − 4x + 3
- Press: x x² − 4 × x + 3
This parabola has:
- Vertex at x = 2
- Roots at x = 1 and x = 3
Polynomial Functions
Example: y = x³ − 3x
- Press: x ^ 3 − 3 × x
Trigonometric Functions
Example: y = 2sin(x)
- Press: 2 × sin ( x )
Example: y = sin(2x) (doubled frequency)
- Press: sin ( 2 × x )
Example: y = sin(x) + 1 (shifted up)
- Press: sin ( x ) + 1
Exponential Functions
Example: y = eˣ
- Press: e ^ x
Example: y = 2ˣ
- Press: 2 ^ x
Logarithmic Functions
Example: y = log(x)
- Press: log ( x )
Example: y = ln(x)
- Press: ln ( x )
Rational Functions
Example: y = 1/x
- Press: 1 ÷ x
Example: y = (x+1)/(x−1)
- Press: ( x + 1 ) ÷ ( x − 1 )
Understanding the Graph Display
Color Coding
Each of the eight function slots, f₁(x) through f₈(x), draws in its own color, matching the color shown next to the slot.
Axis Scaling
The graph automatically scales to show your functions. The display adapts to:
- The range of your function values
- The most useful viewing window
Comparing Functions
Example: Explore y = x, y = x², y = x³
Plot all three to see how polynomial degree affects the curve:
- f₁(x) = x (linear - straight line)
- f₂(x) = x² (quadratic - parabola)
- f₃(x) = x³ (cubic - S-curve)
Observations:
- All pass through origin (0,0) and (1,1)
- Higher powers grow faster for x > 1
- Higher powers approach 0 faster for 0 < x < 1
Example: Damped Oscillation
Plot y = e⁻ˣ × sin(5x):
- Press: e ^ ( (−) x ) × sin ( 5 × x )
This shows a sine wave that decreases in amplitude over time—common in physics and engineering.
Practical Applications
Finding Intersections
Plot two functions to visually find where they intersect:
Example: Where does x² = 2x + 3?
- f₁(x) = x²
- f₂(x) = 2x + 3
The graphs intersect at x = −1 and x = 3.
Analyzing Transformations
Horizontal Shift
Compare y = sin(x) and y = sin(x − π/2):
- The second is shifted right by π/2
Vertical Shift
Compare y = x² and y = x² + 3:
- The second is shifted up by 3 units
Vertical Stretch
Compare y = sin(x) and y = 2sin(x):
- The second has double the amplitude
Horizontal Compression
Compare y = sin(x) and y = sin(2x):
- The second has half the period (double frequency)
Studying Limits and Asymptotes
Example: y = 1/x
Plot this to see:
- Vertical asymptote at x = 0
- Horizontal asymptote at y = 0
- Behavior in all four quadrants
Example: y = (x² − 1)/(x − 1)
This appears to have a hole at x = 1, since the function simplifies to x + 1 for x ≠ 1.
Tips for Effective Graphing
1. Start Simple
Begin with the basic form, then add complexity:
- First: y = sin(x)
- Then: y = 2sin(x)
- Then: y = 2sin(x) + 1
- Finally: y = 2sin(3x) + 1
2. Use Parentheses
Avoid ambiguity in your expressions:
- Correct: sin(2x) for sine of 2x
- Ambiguous: sin2x might be interpreted differently
3. Compare Related Functions
Use multiple function slots to understand relationships:
- Function and its derivative
- Function and its inverse
- Original and transformed versions
4. Look for Key Features
When analyzing a graph, identify:
- Intercepts: Where does it cross the axes?
- Extrema: Maximum and minimum points
- Asymptotes: Lines the graph approaches
- Symmetry: Even, odd, or neither?
- Period: For periodic functions
Educational Applications
Calculus
- Visualize derivatives as tangent line slopes
- Understand integrals as areas under curves
- Explore limits and continuity
Trigonometry
- See the unit circle relationships
- Understand period, amplitude, and phase
- Compare different trig functions
Algebra
- Solve equations graphically
- Understand polynomial behavior
- Explore rational functions
Physics
- Model projectile motion (parabolas)
- Visualize wave functions
- Analyze harmonic oscillation
Common Mistakes to Avoid
1. Forgetting the Variable
Enter sin(x), not just sin().
2. Wrong Angle Units
For trigonometric functions, be aware of radian vs. degree expectations.
3. Invalid Expressions
Some expressions have restricted domains:
- log(x) only works for x > 0
- √x only works for x ≥ 0 (real numbers)
4. Missing Multiplication
Write 2*x not 2x (depending on keyboard mode).
Fun Functions to Try
Here are some interesting graphs to explore:
Heart Shape
Try plotting parametric-style equations or find creative combinations!
Spiral
Explore exponential + trigonometric combinations.
Chaos
Plot y = sin(tan(x)) for an interesting pattern.
Circle Approximation
Plot y = √(1 − x²) for the top half of a unit circle.
Conclusion
Calc Pro's Graphing Calculator transforms abstract equations into visual understanding. Whether you're a student learning about functions or a professional analyzing data, graphical visualization provides insights that numbers alone cannot convey.

Calc Pro
4.6 · 4,712 ratingsPut the Graphing Calculator to work
Use it free in your browser right now, or take Calc Pro with you on iPhone and iPad.
Take it with you




Free with ads · In-app purchase unlocks the full Pro Premium version