Investing and Options Calculators: Stocks, Dividends, Bonds and Black-Scholes
Calculate stock returns, average cost, dividend income, bond yields, options profit and Black-Scholes prices with Calc Pro's investing worksheets.
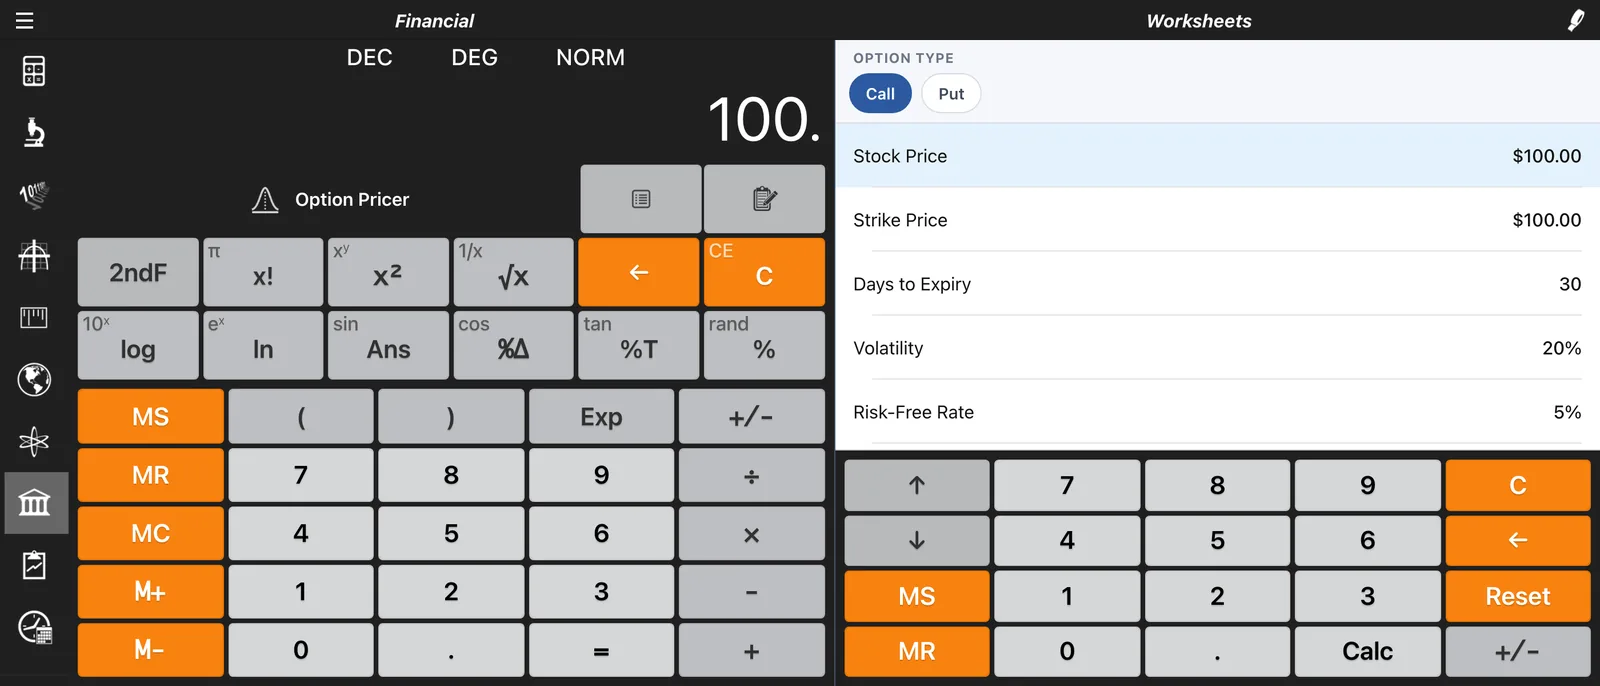
Calc Pro's Financial calculator includes seven worksheets built for investors and traders: Stock Return, Average Cost, Dividend Income, Options Profit/Loss, Black-Scholes, Position Size and Bond. This guide walks through each one with a worked example.
In the iPhone and iPad app, all seven investing worksheets are part of Pro Premium. They're free in the web version. The examples are for learning only, not financial advice.
Stock Return
See what a trade really made, after commissions, and what that works out to per year.
Example: you bought 100 shares at $50, sold at $65 400 days later, and paid $10 in commissions.
- Gain/Loss: $1,490.00
- Return: 29.74%
- Annualized Return: 26.82%, because you held the shares for longer than a year
- Break-Even Price: $50.10, the sale price that covers your costs
Average Cost (Dollar-Cost Averaging)
Bought more of a stock at a different price? Find your new average cost.
Example: you own 100 shares at an average of $50, then buy 50 more at $40.
- New Avg Cost: $46.67
- Total Shares: 150
- Total Invested: $7,000.00
Dividend Income
Project dividend income over time, with or without reinvesting.
Example: 200 shares at $40, paying $1.60 a share a year, with dividends growing 5% a year, for 10 years.
| Result | Reinvest dividends | Take as cash |
|---|---|---|
| Current Yield | 4.00% | 4.00% |
| Annual Income (now) | $320.00 | $320.00 |
| Income in Final Year | $763.47 | $496.43 |
| Total Dividends | $5,066.95 | $4,024.93 |
| Final Shares | 326 | 200 |
Reinvesting buys more shares every year, so by year ten your dividend income is over 50% higher than taking it as cash.
Options Profit/Loss
Model four common strategies at expiry: Long Call, Long Put, Covered Call and Cash-Secured Put. Each contract covers 100 shares.
Example 1: Long Call. You buy 2 contracts with a $100 strike for a $4 premium, and the stock finishes at $112.
- Profit/Loss: $1,600.00
- Break-Even Price: $104.00
- Max Gain: Unlimited
- Max Loss: −$800.00, the premium you paid
Example 2: Covered Call. You own 100 shares bought at $50 and sell 1 call with a $55 strike for a $1.50 premium. The stock finishes at $58.
- Profit/Loss: $650.00, since your shares are called away at $55
- Break-Even Price: $48.50
- Max Gain: $650.00
- Max Loss: −$4,850.00, if the stock fell to zero
Black-Scholes Option Pricer
Estimate what an option is worth, and how its price will react to changes, using the Black-Scholes model.
Example: a call option with the stock at $100, a $105 strike, 30 days to expiry, 25% volatility, a 4.5% risk-free rate and no dividends.
- Option Price: $1.18
- Delta: 0.2765, so the option gains about $0.28 for every $1 the stock rises
- Gamma: 0.0467, how much delta changes for each $1 move in the stock
- Theta/Day: −0.0432, so the option loses about 4 cents of value each day from time decay
- Vega: 0.0959, so the option gains about 10 cents for each 1% rise in volatility
Position Size
Size a trade so you only risk a set share of your account.
Example: a $25,000 account, risking 1%, entering at $50 with a stop-loss at $47.
- Shares to Buy: 83
- Position Cost: $4,150.00
- Amount at Risk: $249.00, just under the $250 (1%) you set
Bond
Price a bond from its yield, or find its yield to maturity from its price.
Example: a $1,000 bond with a 4% coupon, paid semi-annually, maturing in 10 years.
- At a 5% yield to maturity, the Bond Price is $922.05, with a Current Yield of 4.34%
- If the bond sells for $950, its Yield to Maturity is 4.63%
When yields rise above the coupon rate, the bond's price falls below its face value, and vice versa.
Tips
- Include every cost. Commissions change your break-even price and your real return.
- Annualize to compare. A 30% return over three years isn't the same as 30% in one; use Annualized Return.
- Know your max loss first. Check Max Loss on Options Profit/Loss before you trade.
- Share your analysis. With Pro Premium, save or e-mail any worksheet as a PDF.
For every other worksheet, see the Financial Calculator guide.

Calc Pro
4.6 · 4,712 ratingsPut the Financial Calculator to work
Use it free in your browser right now, or take Calc Pro with you on iPhone and iPad.
Take it with you




Free with ads · In-app purchase unlocks the full Pro Premium version